Attaching package: 'scales'

The following object is masked from 'package:purrr':

    discard

The following object is masked from 'package:readr':

    col_factor
fisheries <-read_csv("data/fisheries.csv")
Rows: 82 Columns: 4
── Column specification ────────────────────────────────────────────────────────
Delimiter: ","
chr (1): country
dbl (3): capture, aquaculture, total

ℹ Use `spec()` to retrieve the full column specification for this data.
ℹ Specify the column types or set `show_col_types = FALSE` to quiet this message.
continents <-read_csv("data/continents.csv")
Rows: 245 Columns: 2
── Column specification ────────────────────────────────────────────────────────
Delimiter: ","
chr (2): country, continent

ℹ Use `spec()` to retrieve the full column specification for this data.
ℹ Specify the column types or set `show_col_types = FALSE` to quiet this message.
Working with multiple data frames
Often instead of being provided the data you need for your analysis in a single data frame, you will need to bring information from multiple datasets together into a data frame yourself. These datasets will be linked to each other via a column (usually an identifier, something that links the two datasets together) that you can use to join them together.
There are many possible types of joins. All have the format something_join(x, y).
semi_join(): return all rows from x with match in y
semi_join(x, y)
Joining, by = "value"
# A tibble: 2 × 2
  value xcol
  <dbl> <chr>
1     1 x1
2     2 x2
anti_join(): return all rows from x without a match in y
anti_join(x, y)
Joining, by = "value"
# A tibble: 1 × 2
  value xcol
  <dbl> <chr>
1     3 x3
Question: How do the join functions above know to join x and y by value? Hint: Examine the column names to find out.
names(x)
[1] "value" "xcol"
names(y)
[1] "value" "ycol"
Global aquaculture production
The Fisheries and Aquaculture Department of the Food and Agriculture Organization of the United Nations collects data on fisheries production of countries.
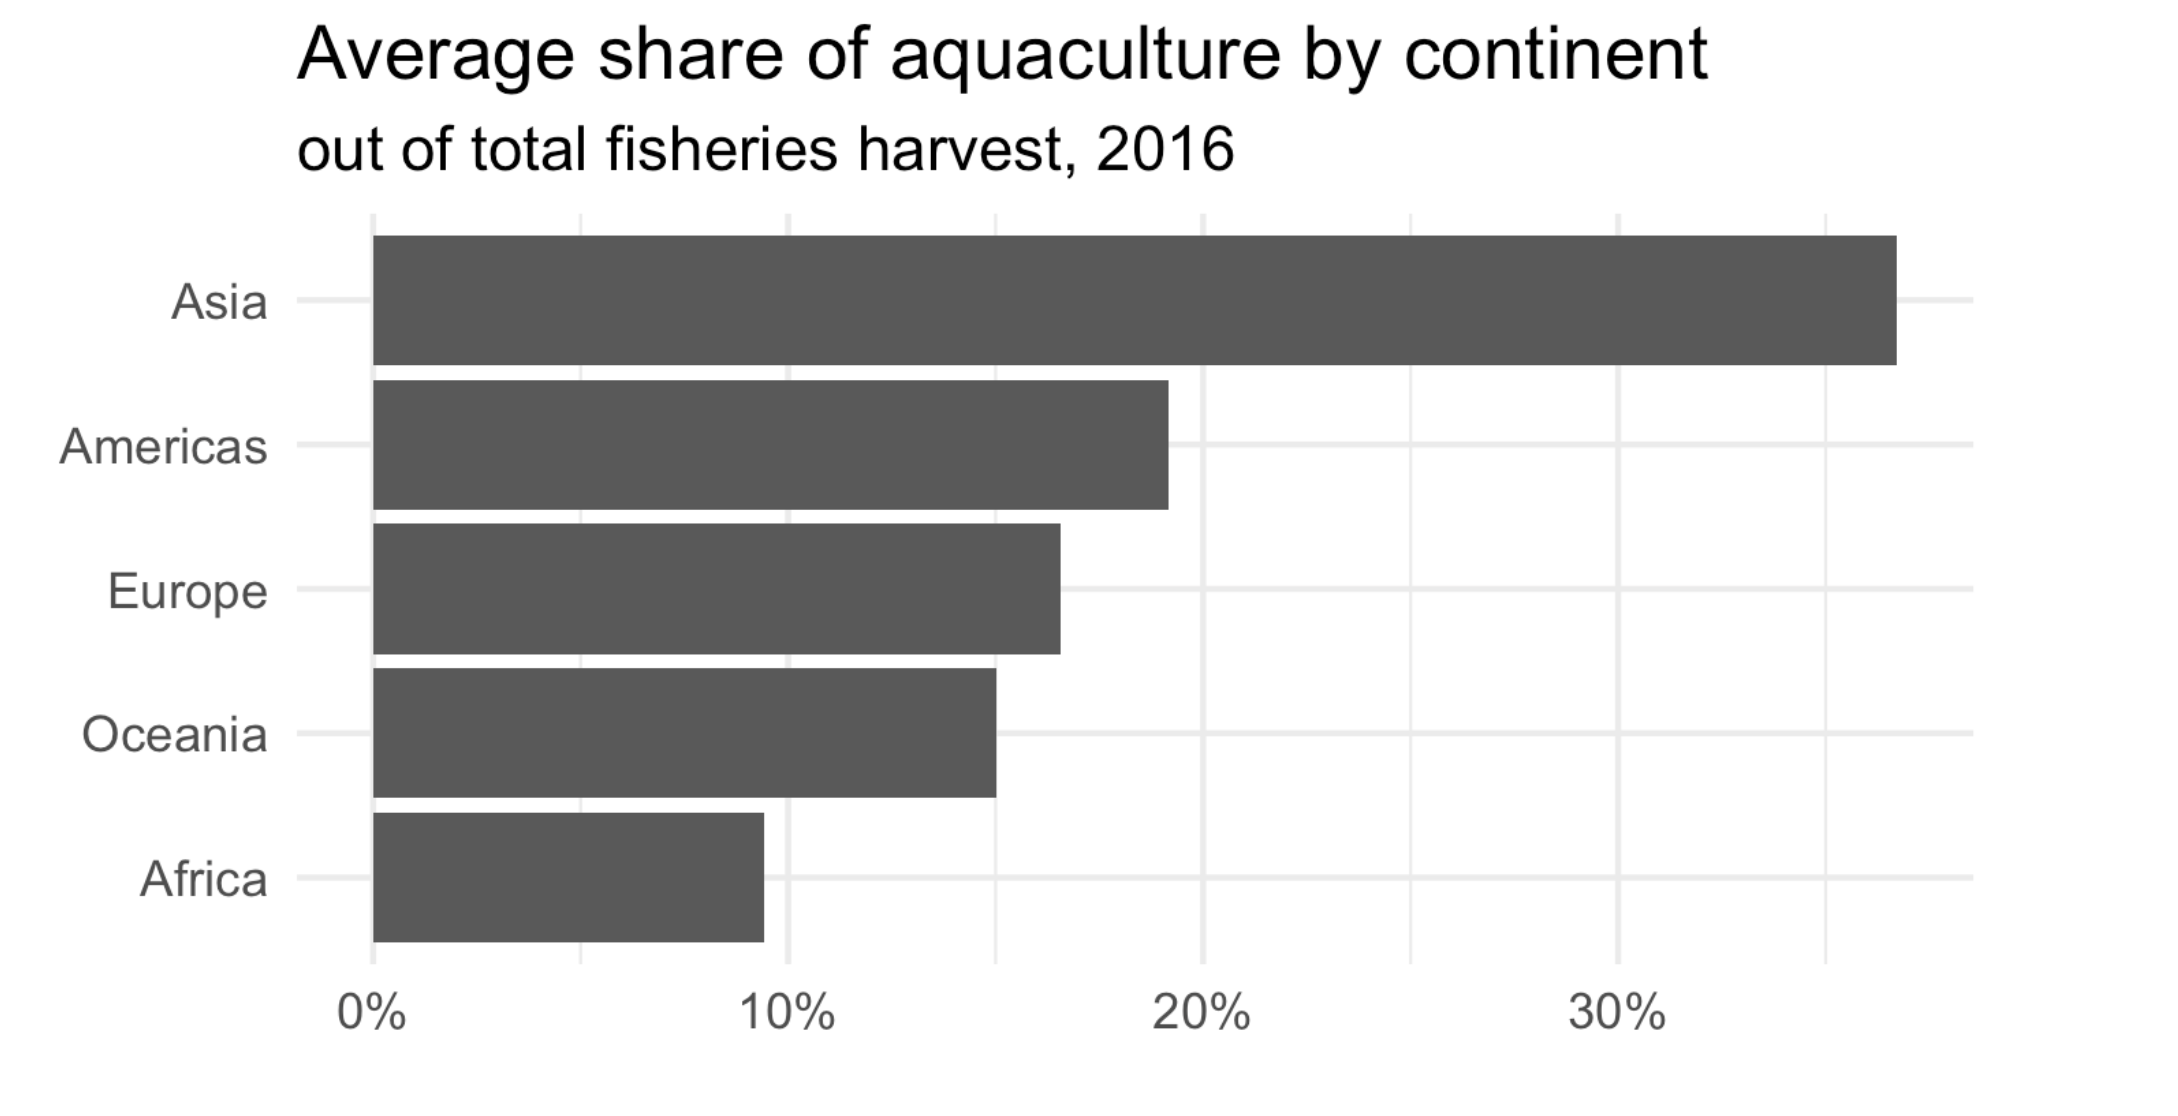
Our goal is to create a visualization of the mean share of aquaculture by continent.
Let’s start by looking at the fisheries data frame.
Which variable(s) will we use to join the fisheries and continents data frames?
We want to keep all rows and columns from fisheries and add a column for corresponding continents. Which join function should we use?
Demo: Join the two data frames and name assign the joined data frame back to fisheries.
# add code here
Demo: Take a look at the updated fisheries data frame. There are some countries that were not in continents. First, identify which countries these are (they will have NA values for continent). Then, manually update the continent information for these countries using the case_when function. Finally, check that these updates have been made as intended and no countries are left without continent information.
# add code here
Demo: Add a new column to the fisheries data frame called aq_prop. We will calculate it as aquaculture / total. Save the resulting frame as fisheries.
# add code here
Demo: Calculate the mean aquaculture proportion (we’ll call it mean_aq_prop) for continents in the fisheries data using the summarize() function in dplyr. Note that the function for calculating the mean is mean() in R.
# add code here
Your turn (5 minutes): Now expand your calculations to also calculate the minimum and maximum aquaculture proportion for continents in the fisheries data. Note that the functions for calculating minimum and maximum in R are min() and max() respectively.
# add code here
Demo: Create a new data frame called fisheries_summary that calculates minimum, mean, and maximum aquaculture proportion for each continent in the fisheries data. Then, determine which continent has the largest value of max_ap?
# add code here
Demo: Take the fisheries_summary data frame and order the results in descending order of mean aquaculture proportion.
# add code here
Demo: Recreate the following plot using the data frame you have developed so far.
# add code here
Your turn (time permitting): Change the theme of the plot and make any other changes you would like to improve it.