library(tidyverse)
library(skimr)
library(scales)AE 06: Data types and classes
Application exercise
Important
Go to the course GitHub organization and locate the repo titled ae-05-YOUR_GITHUB_USERNAME to get started.
This AE is due Sunday, Sep 26 at 11:59pm.
Packages
We will use the following two packages in this application exercise.
- tidyverse: For data import, wrangling, and visualization.
- skimr: For summarizing the entire data frame at once.
- scales: For better axis labels.
Type coercion
Demo: Determine the type of the following vector. And then, change the type to numeric.
x <- c("1", "2", "3")
typeof(x)
[1] "character"as.numeric(x)[1] 1 2 3Demo: Once again, determine the type of the following vector. And then, change the type to numeric. What’s different than the previous exercise?
y <- c("a", "b", "c")

# add code here
Demo: Once again, determine the type of the following vector. And then, change the type to numeric. What’s different than the previous exercise?
z <- c("1", "2", "three")

# add code here
Demo: Suppose you conducted a survey where you asked people how many cars their household owns collectively. And the answers are as follows:
survey_results <- tibble(cars = c(1, 2, "three"))
survey_results
# A tibble: 3 × 1 cars <chr> 1 1 2 2 3 threeThis is annoying because of that third survey taker who just had to go and type out the number instead of providing as a numeric value. So now you need to update the
carsvariable to be numeric. You do the followingsurvey_results |> mutate(cars = as.numeric(cars))Warning in mask$eval_all_mutate(quo): NAs introduced by coercion# A tibble: 3 × 1 cars <dbl> 1 1 2 2 3 NAAnd now things are even more annoying because you get a warning
NAs introduced by coercionthat happened while computingcars = as.numeric(cars)and the response from the third survey taker is now anNA(you lost their data). Fix yourmutate()call to avoid this warning.# add code hereYour turn (8 minutes): First, guess the type of the vector. Then, check if you guessed right. I’ve done the first one for you, you’ll see that it’s helpful to check the type of each element of the vector first.
c(1, 1L, "C")v1 <- c(1, 1L, "C") # to help you guess typeof(1)[1] "double"typeof(1L)[1] "integer"typeof("C")[1] "character"# to check after you guess typeof(v1)[1] "character"c(1L / 0, "A")v2 <- c(1L / 0, "A") # to help you guess # to check after you guessc(1:3, 5)v3 <- c(1:3, 5) # to help you guess # to check after you guessc(3, "3+")v4 <- c(3, "3+") # to help you guess # to check after you guessc(NA, TRUE)v5 <- c(NA, TRUE) # to help you guess # to check after you guess
Hotel bookings
# From TidyTuesday: https://github.com/rfordatascience/tidytuesday/blob/master/data/2020/2020-02-11/readme.md

hotels <- read_csv("https://raw.githubusercontent.com/rfordatascience/tidytuesday/master/data/2020/2020-02-11/hotels.csv")
Question: Take a look at the the following visualization. How are the months ordered? What would be a better order?
Add your response here.
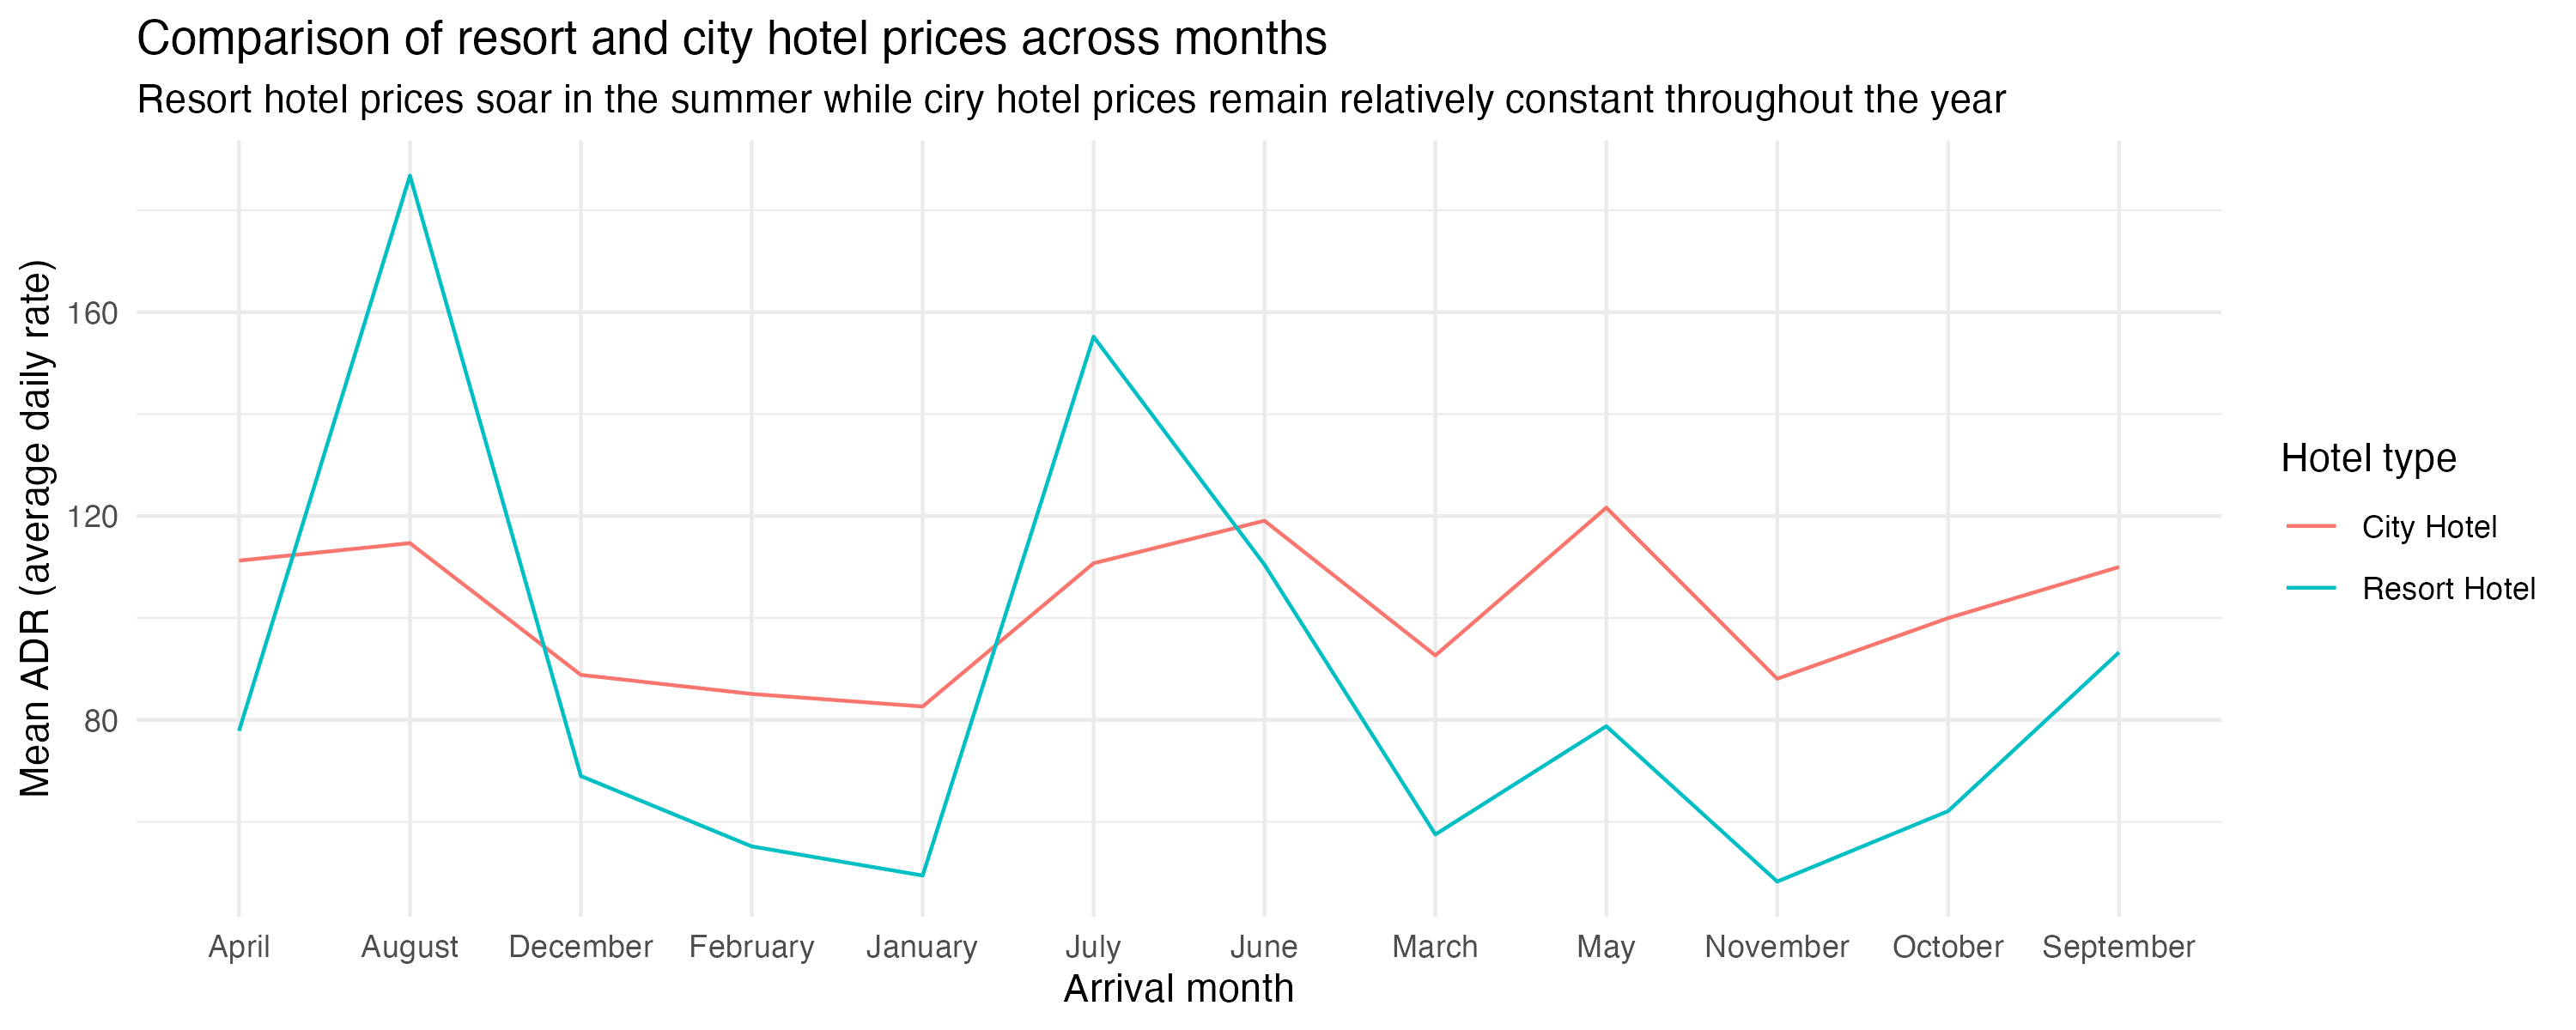
Demo: Reorder the months on the x-axis (levels of arrival_date_month) in a way that makes more sense. You will want to use a function from the forcats package, see https://forcats.tidyverse.org/reference/index.html for inspiration and help.
# add code hereStretch goal: If you finish the above task before time is up, change the y-axis label so the values are shown with dollar signs, e.g. $80 instead of 80. You will want to use a function from the scales package, see https://scales.r-lib.org/reference/index.html for inspiration and help.
# add code here