library(tidyverse)
library(tidymodels)Inference overview
Application exercise
Answers
rc <- read_csv("data/roller_coasters.csv")In this application exercise, we will be looking at a roller coaster and amusement park database by Duane Marden.1 This database records multiple features of roller coasters. For the purpose of this activity, we will work with a random sample of 157 roller coasters.
| Variable | Description |
|---|---|
age_group |
1: Older (Built between 1900-1979) 2: Recent (1980-1999) 3: Newest (2000-current) |
coaster |
Name of the roller coaster |
park |
Name of the park where the roller coaster is located |
city |
City where the roller coaster is located |
state |
State where the roller coaster is located |
type |
Material of track (Steel or Wooden) |
design |
How a passenger is positioned in the roller coaster: Flying: a roller coaster ridden while parallel with the track. Inverted: a roller coaster which uses trains traveling beneath, rather than on top of, the track. Unlike a suspended roller coaster, an inverted roller coaster’s trains are rigidly attached to the track. Sit Down: a traditional roller coaster ridden while sitting down. Suspended: a roller coaster using trains which travel beneath the track and pivot on a swinging arm from side to side, exaggerating the track’s banks and turns. Stand Up: a coaster ridden while standing up instead of sitting down. Pipeline: a coaster where riders are positioned between the rails instead of above or below. Wing: a coaster where pairs of riders sit on either side of a roller coaster track in which nothing is above or below the riders. 4th Dimension: a coaster where the cars have the ability to rotate on an axis perpendicular to that of the track. |
year_opened |
Year when roller coaster opened |
top_speed |
Maximum speed of roller coaster (mph) |
max_height |
Highest point of roller coaster (ft) |
drop |
Length of largest gap between high and low points of roller coaster (ft) |
length |
Length of roller coaster track (ft) |
duration |
Time length of roller coaster ride (sec) |
inversions |
Whether or not roller coaster flips passengers at any point (Yes or No) |
num_of_inversions |
Number of times roller coaster flips passengers |
Research question 1
Is the true proportion of steel roller coasters opened before 1970 different than those opened after 1970?
- Demo: Create a new variable called
opened_recentlythat has a response ofyesif the roller coaster was opened after 1970, andnoif the roller coaster was opened during or before 1970. Save this new factor variable in thercdata set. Additionally, maketypea factor variable.
rc <- rc |>
  mutate(
    opened_recently = if_else(year_opened > 1970, "yes" , "no"),
    opened_recently = as.factor(opened_recently),
    type = as.factor(type)
) - Your turn: Based on the research question, which of the following is the appropriate null hypothesis?
\(H_0\): \(\mu = 0.5\)
\(H_0\): \(p > 0.5\)
\(H_0\): \(\mu_1 - \mu_2 = 0\)
\(H_0\): \(p_1 - p_2 = 0\)
The answer is (d).
- Demo: Write out the appropriate alternative hypothesis in both words and notation.
\(H_A\): \(p_1 - p_2 \ne 0\)
- Demo: Calculate the observed statistic.
point_estimate <- rc |>
  specify(type ~ opened_recently, success = "Steel") |>
  calculate(stat = "diff in props", order = c("yes", "no"))
Demo: How do we create a null distribution for this hypothesis test? Write out the steps below.
- Shuffle responses into one pile.
- Redistribute data into two new piles of size n1 and n2.
- Calculate new difference in proportions.
- Repeat steps 1-3 many times to create the null distribution.
Demo: Create the null distribution with 1,000 repeated samples.
set.seed(101821)

null_dist <- rc %>%
  specify(type ~ opened_recently, success = "Steel") %>%
  hypothesize(null = "independence") %>%
  generate(1000, type = "permute") %>%
calculate(stat = "diff in props", order = c("yes", "no"))- Demo: Visualize the null distribution and shade in the area used to calculate the p-value.
visualize(null_dist) +
 shade_p_value(obs_stat = point_estimate, direction = "two sided")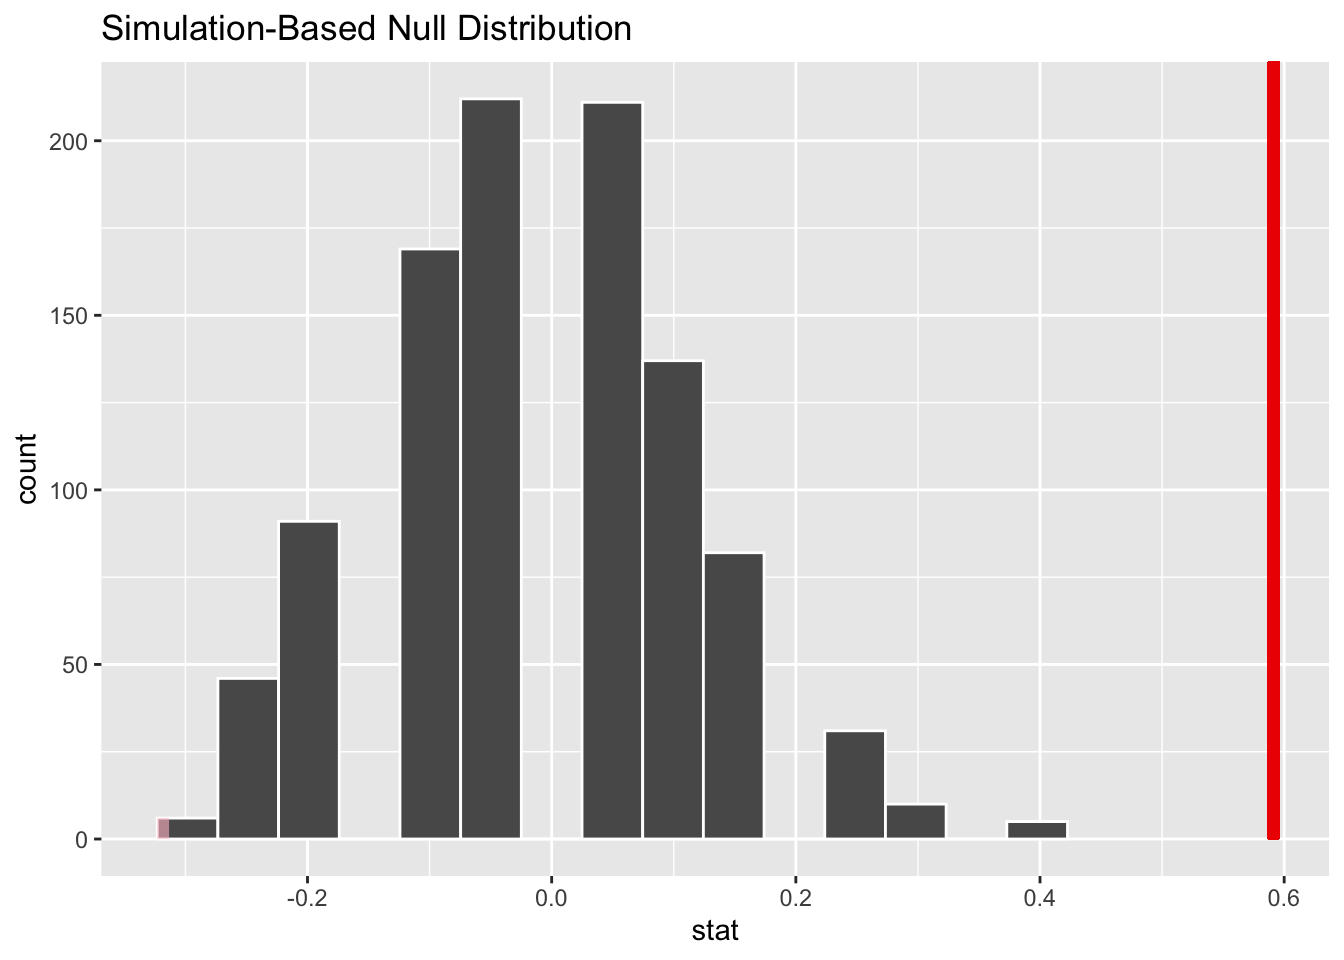
- Your turn: Calculate p-value. Then use the p-value to make your conclusion using a significance level of 0.1 and write out an appropriate conclusion below. Recall that the conclusion has 3 components.
- How the p-value compares to the significance level.
- The decision you make with respect to the hypotheses (reject \(H_0\) /fail to reject \(H_0\))
- The conclusion in the context of the alternative hypothesis.
Since the p-value is smaller than 10%, we reject the null hypothesis in favor of the alternative hypothesis. The data provide convincing evidence that the proportion of steel roller coasters opened before 1970 is different than those opened after 1970.
null_dist |>
  get_p_value(obs_stat = point_estimate, direction = "two sided")
Warning: Please be cautious in reporting a p-value of 0. This result is an
approximation based on the number of `reps` chosen in the `generate()` step. See
`?get_p_value()` for more information.# A tibble: 1 × 1
p_value
<dbl>
1 0Research question 2
We want to investigate the relationship between how fast a roller coaster goes, and how long a roller coaster lasts. Specifically, we are interested in how well the duration of a roller coaster explains or predicts how fast it is.
- Question: Based on this research question, which two variables should we use from our data set? Which is our response?
top_speed and duration.
- Demo: Fit a model predicting
top_speedfromdurationand display the tidy summary output.
speed_fit <- linear_reg() |>
  fit(top_speed ~ duration, data = rc)

tidy(speed_fit)
# A tibble: 2 × 5
term estimate std.error statistic p.value
<chr> <dbl> <dbl> <dbl> <dbl>
1 (Intercept) 52.0 4.08 12.8 3.99e-24
2 duration 0.0560 0.0305 1.83 6.92e- 2- Your turn: Use your model to estimate the top speed of a roller coaster if their duration is 155 minutes
duration_155 <- tibble(duration = 155)

predict(speed_fit, new_data = duration_155)
# A tibble: 1 × 1
.pred
<dbl>
1 60.7- Demo: Write out the estimated model in proper notation and interpret the slope coefficient
\(\widehat{top~speed} = 52 + 0.056 \times duration\)
For each additional second the ride is longer, the predicted top speed of the roller coaster is higher by 0.057 miles per hour, on average.
- Question: The slope you calculated and interpeted above is a sample statistic (an estimate). It is possible (and quite likely) that the true slope of the relationship between durations and top speeds of all roller coasters is not exactly equal to this value. How can we quantify the uncertainty around this estimate?
Use a confidence interval.
- Your turn: Describe how we can construct a bootstrap distribution for the slope of the model predicting
top_speedfromduration.- Take a bootstrap sample of pairs of
top_speedandduration. - Fit a model predicting
top_speedfromdurationusing the bootstrap sample and record the value of the slope. - Repeat steps 1 and 2 many times.
- Take a bootstrap sample of pairs of
- Demo: Now, construct this bootstrap distribution.
set.seed(12345)

boot_df_slope <- rc |>
  specify(top_speed ~ duration) |>
  generate(reps = 1000, type = "bootstrap") |>
  calculate(stat = "slope")
Warning: Removed 34 rows containing missing values.- Demo: Create a 90% confidence interval by filling in the code below.
boot_df_slope |>
  summarize(
    lower = quantile(stat, 0.05),
    upper = quantile(stat, 0.95)
  )
# A tibble: 1 × 2
lower upper
<dbl> <dbl>
1 -0.0195 0.132- Demo: Interpret the confidence interval in the context of the problem.
We are 90% confident that, for each additional second the ride is longer, the predicted top speed of the roller coaster is lower by -0.0195 to higher by 0.132 miles per hour, on average.
- Demo: Now fit a model predicting log of
top_speedfromduration.
rc <- rc |>
  mutate(top_speed_log = log(top_speed))

speed_log_fit <- linear_reg() |>
  fit(top_speed_log ~ duration, data = rc)

tidy(speed_log_fit)
# A tibble: 2 × 5
term estimate std.error statistic p.value
<chr> <dbl> <dbl> <dbl> <dbl>
1 (Intercept) 3.92 0.0686 57.1 2.15e-89
2 duration 0.00104 0.000514 2.03 4.48e- 2- Demo: Write the estimated model and interpret the slope.
\(\widehat{log(top~speed)} = 3.92 + 0.00104 \times duration\)
Recall that to interpret the slope value we need to exponentiate it!
Why?
\[ \begin{aligned} log(y~for~x + 1) - log(y~for~x) &= \beta_1 \\ log\Big(\frac{y~for~x + 1}{y~for~x}\Big) &= \beta_1 \\ e^{log\Big(\frac{y~for~x + 1}{y~for~x}\Big)} &= e^\beta_1 \\ \frac{y~for~x + 1}{y~for~x} &= e^\beta_1 \end{aligned} \]
This implies that our explanatory variable has a multiplicative relationship with our response variable.
For each additional second the ride is longer, the predicted top speed of the roller coaster is higher by a factor of \(e^0.00104 = 1.001\), on average.
Research question 3
We are also interested in investigating if roller coasters opened after 1970 are faster than those opened before. For this question, we want to estimate the difference.
- Question: How is this different from question one? Should we make a confidence interval or conduct a hypothesis test?
We are interested in estimating the difference. This suggests we should make a confidence interval.
- Demo: Now, use bootstrapping to estimate the difference between the true speeds of roller coasters before and after 1970.
set.seed(12345)

boot_df <- rc |>
  specify(top_speed ~ opened_recently) |>
  generate(reps = 1000, type = "bootstrap") |>
  calculate(stat = "diff in means", order = c("yes", "no"))
Warning: Removed 11 rows containing missing values.- Your turn: Create a 99% confidence interval and interpret it in the context of the data and the research question.
boot_df |>
  summarize(
    lower = quantile(stat, 0.005),
    upper = quantile(stat, 0.995)
  )
# A tibble: 1 × 2
lower upper
<dbl> <dbl>
1 8.88 23.3We are 99% confident that the true mean speed between roller coasters after 1970 are 8.88 to 23.3 mph higher than the true mean speed for roller coasters before 1970.
Discussion
- Brainstorm the differences between generating new samples via bootstrapping and permuting. Write down the key differences below. Hint: Think back to the different sampling techniques between research question 1 and research questions 2 and 3.