Meet the toolkit
Lecture 2
9/1/22
R and RStudio
![]()
- R is an open-source statistical programming language
- R is also an environment for statistical computing and graphics
- It’s easily extensible with packages
![]()
- RStudio is a convenient interface for R called an IDE (integrated development environment), e.g. “I write R code in the RStudio IDE”
- RStudio is not a requirement for programming with R, but it’s very commonly used by R programmers and data scientists
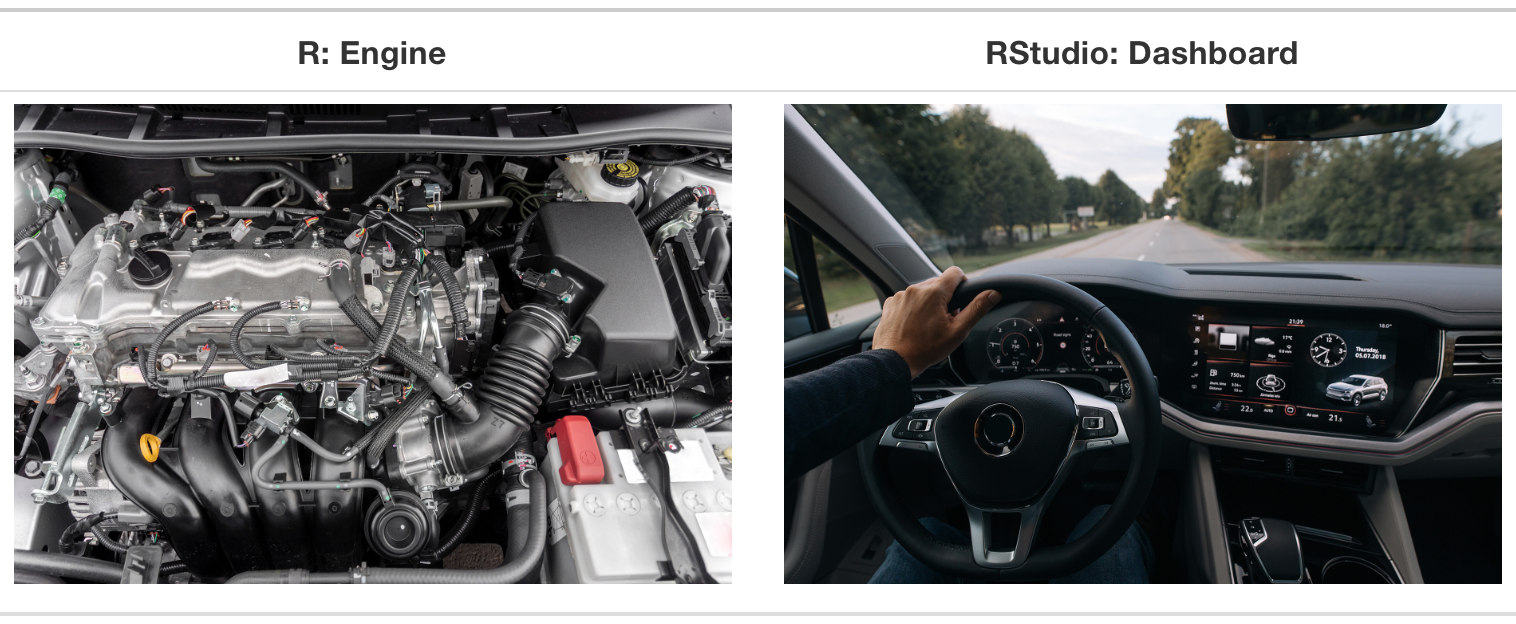
R vs. RStudio
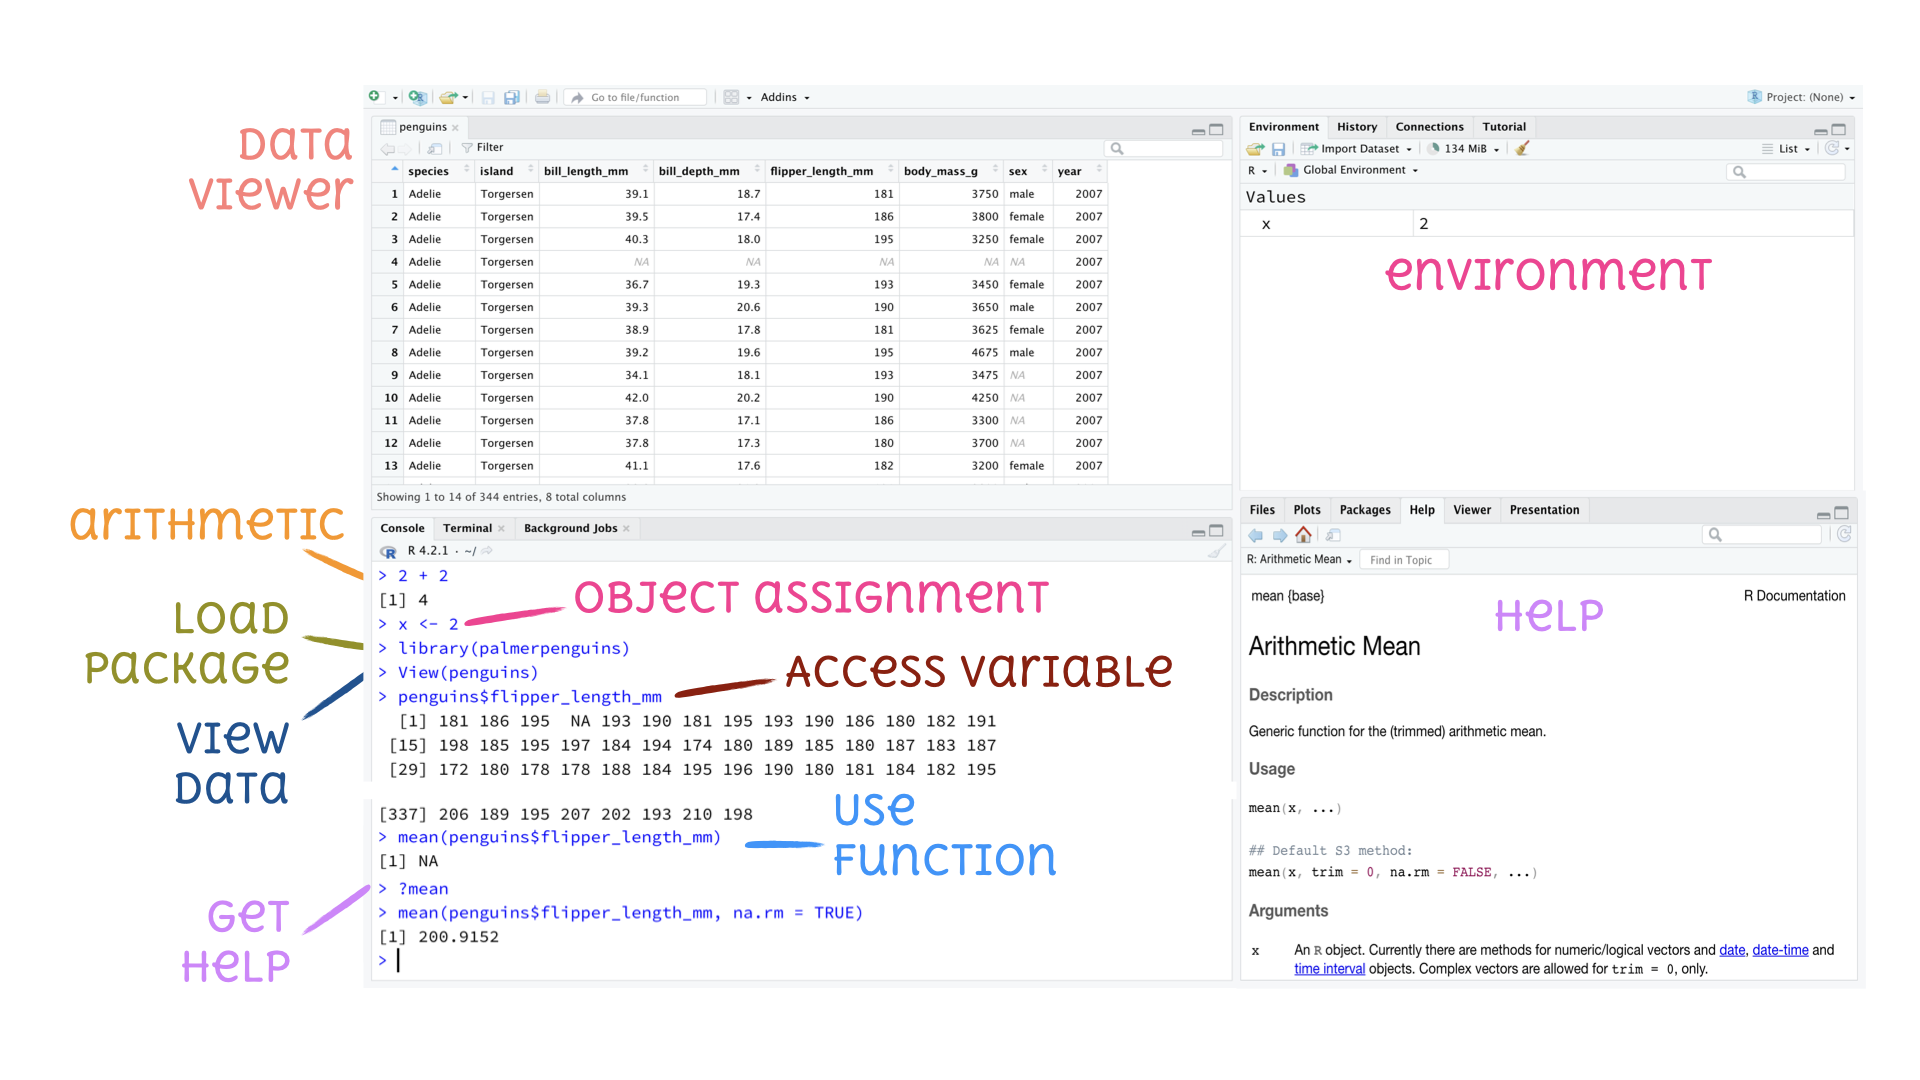
Tour: R and RStudio
tidyverse
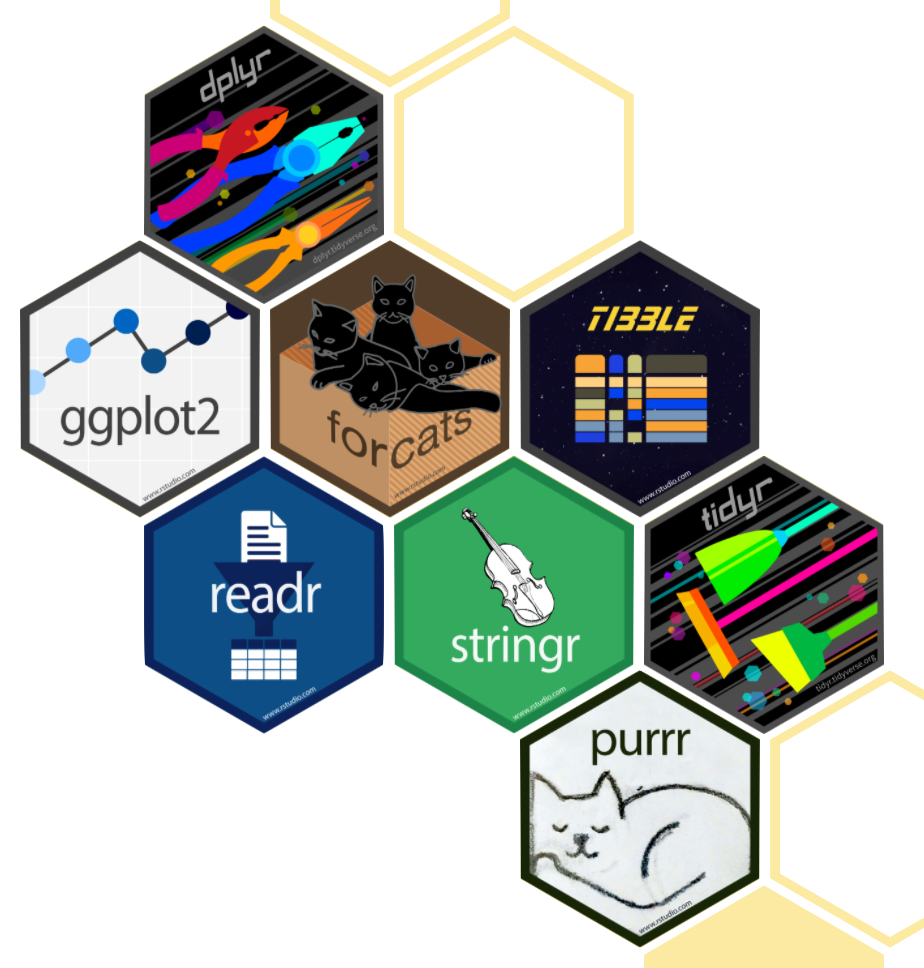
- The tidyverse is an opinionated collection of R packages designed for data science
- All packages share an underlying philosophy and a common grammar
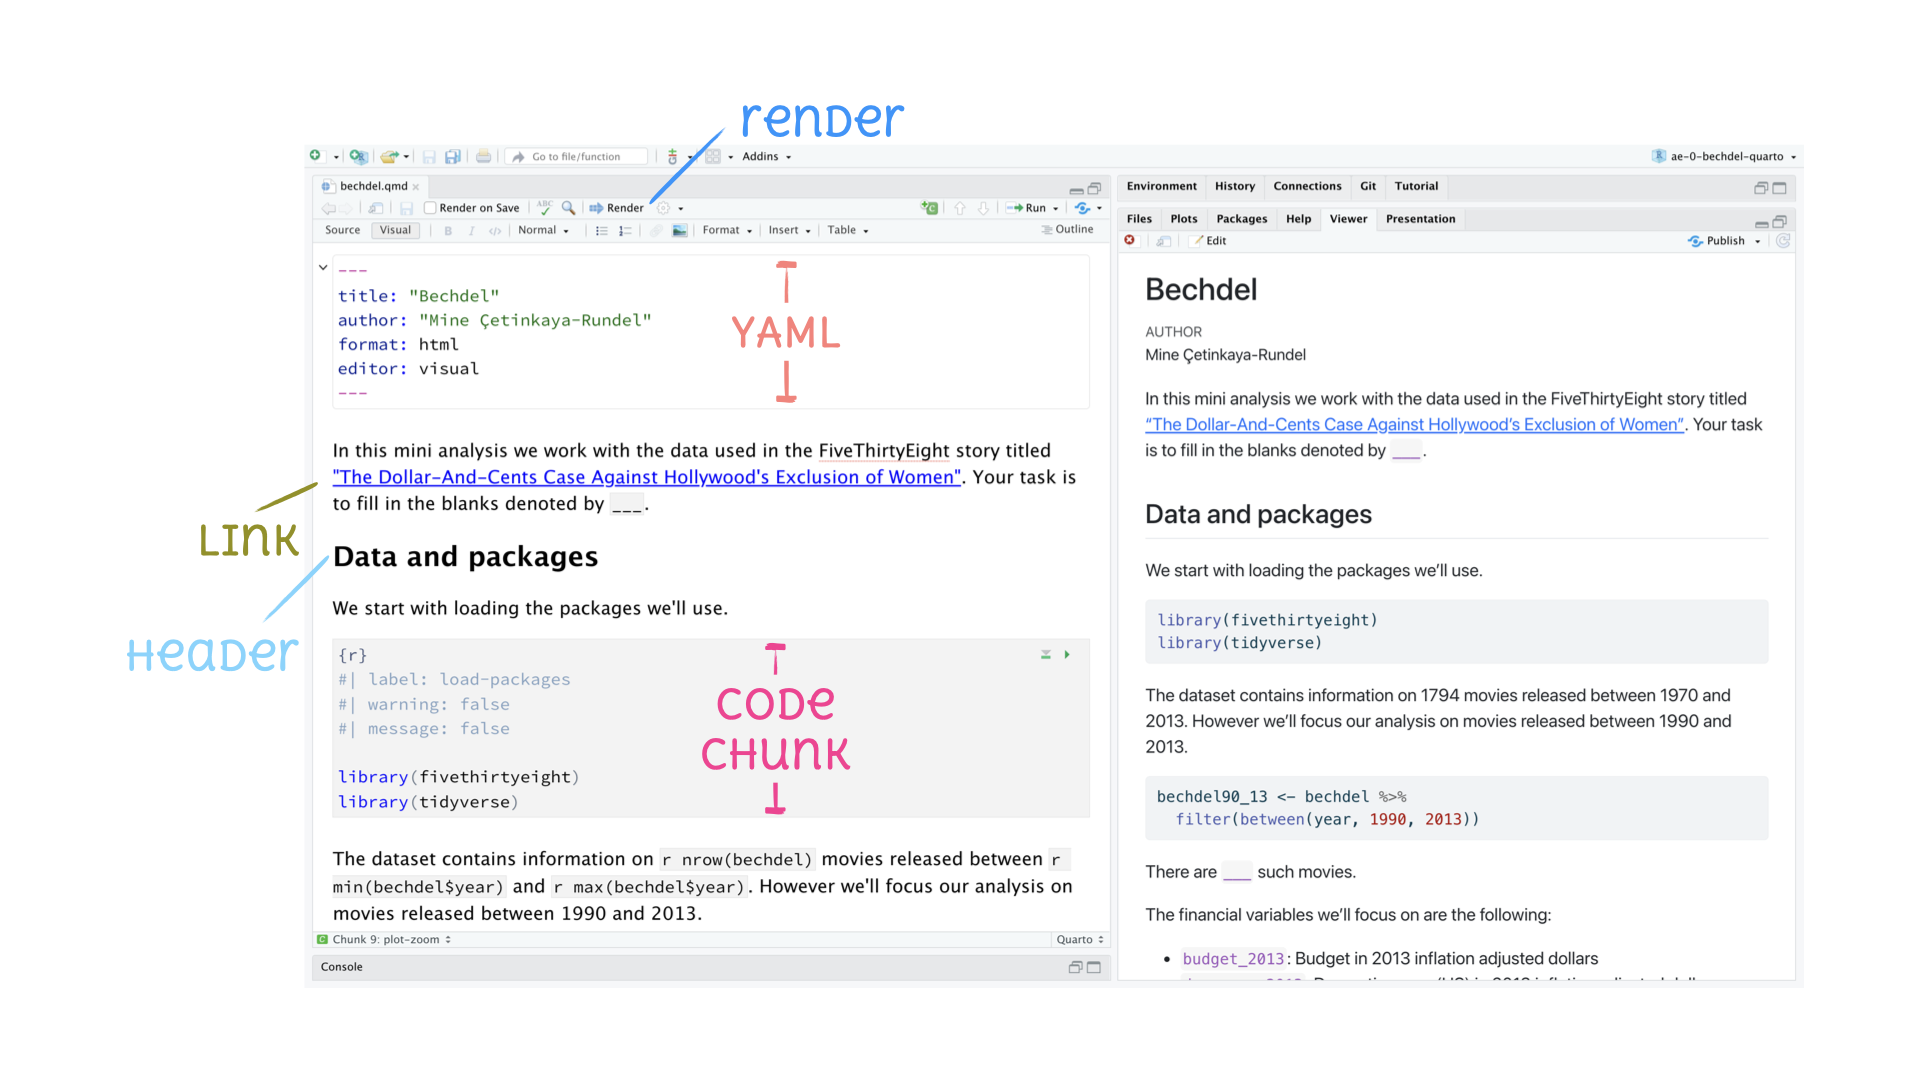
Tour: Quarto
What’s with all the hexes?
Git and GitHub
![]()
- Git is a version control system – like “Track Changes” features from Microsoft Word, on steroids
- It’s not the only version control system, but it’s a very popular one
![]()
GitHub is the home for your Git-based projects on the internet – like DropBox but much, much better
We will use GitHub as a platform for web hosting and collaboration (and as our course management system!)
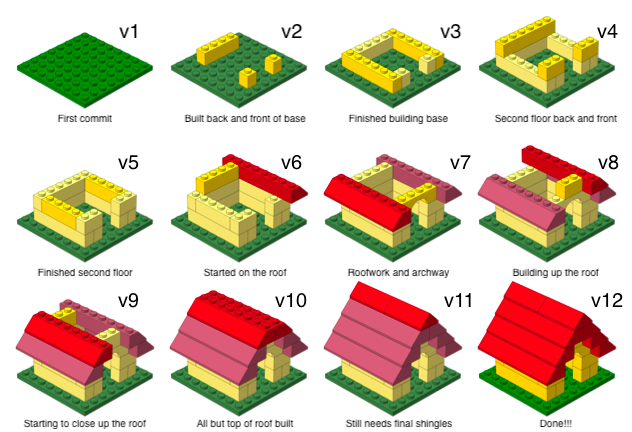
Versioning

Versioning
with human readable messages
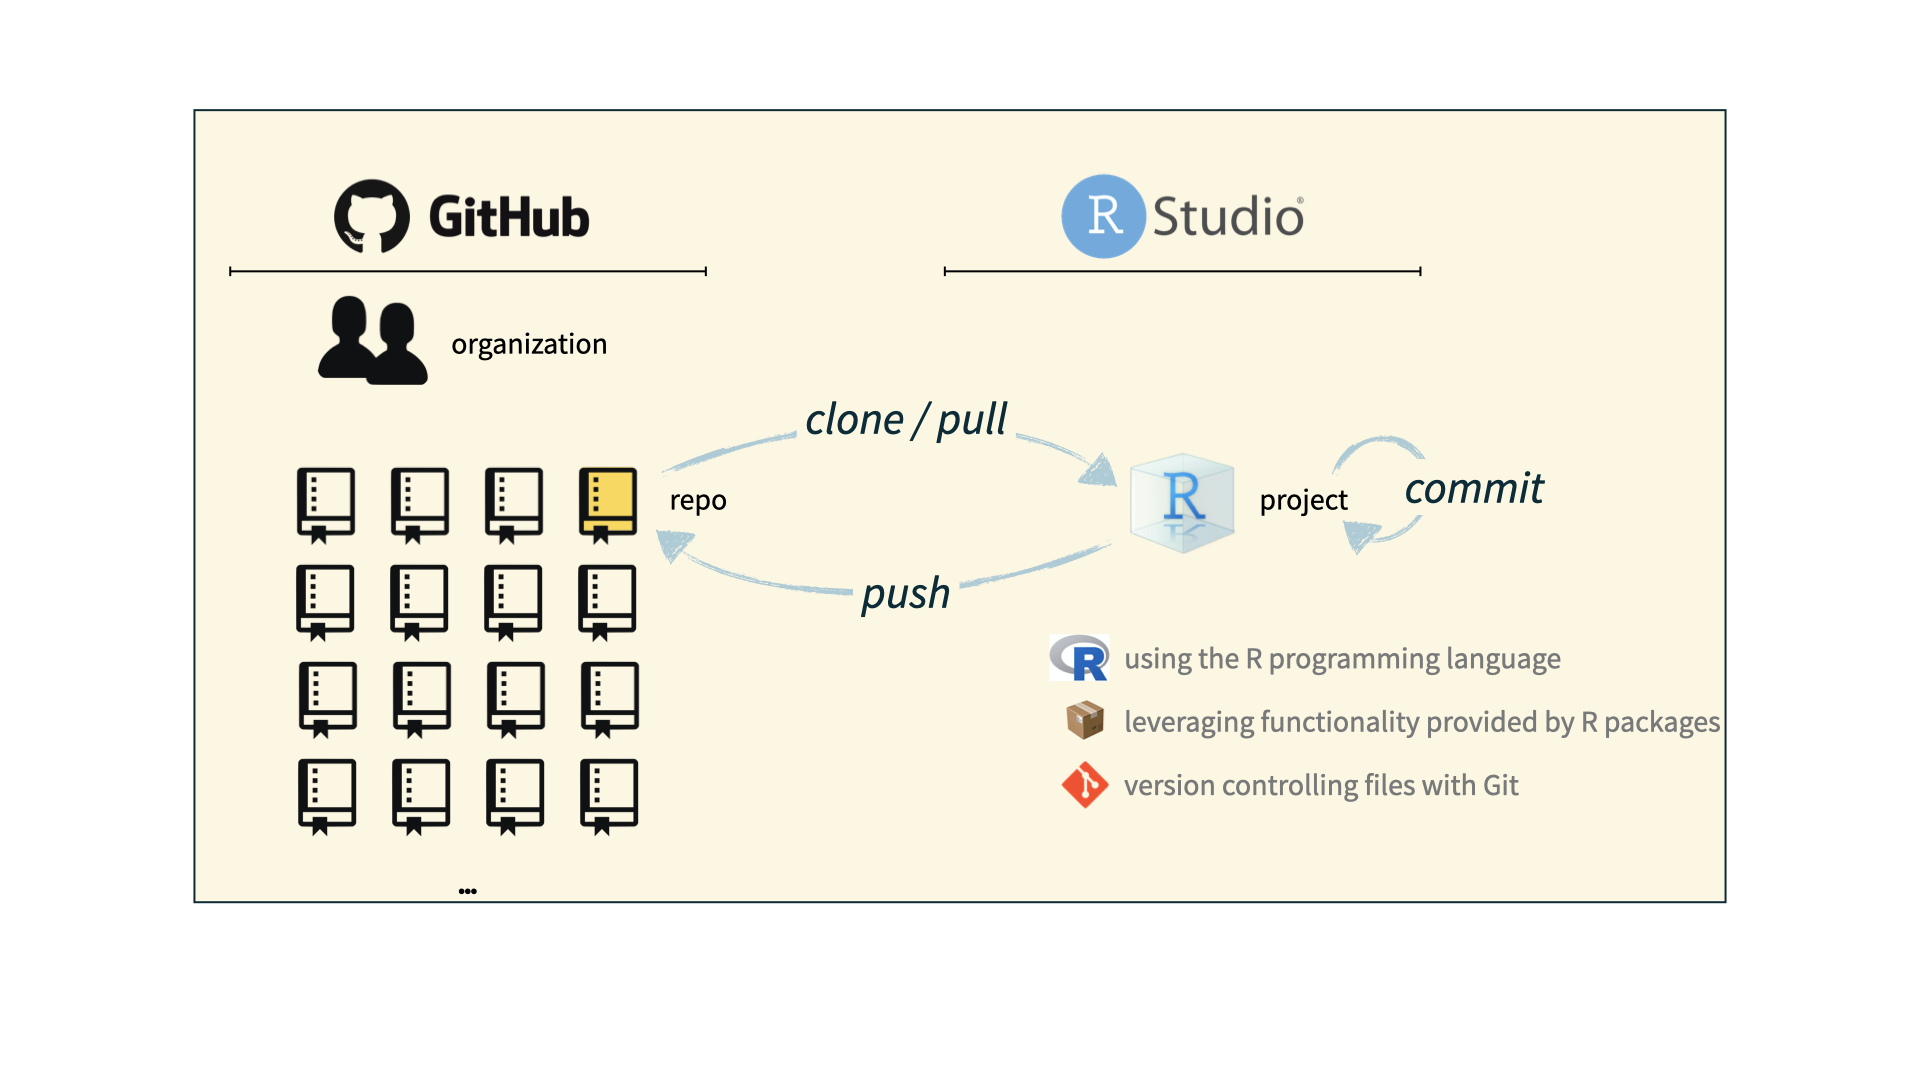
How will we use Git and GitHub
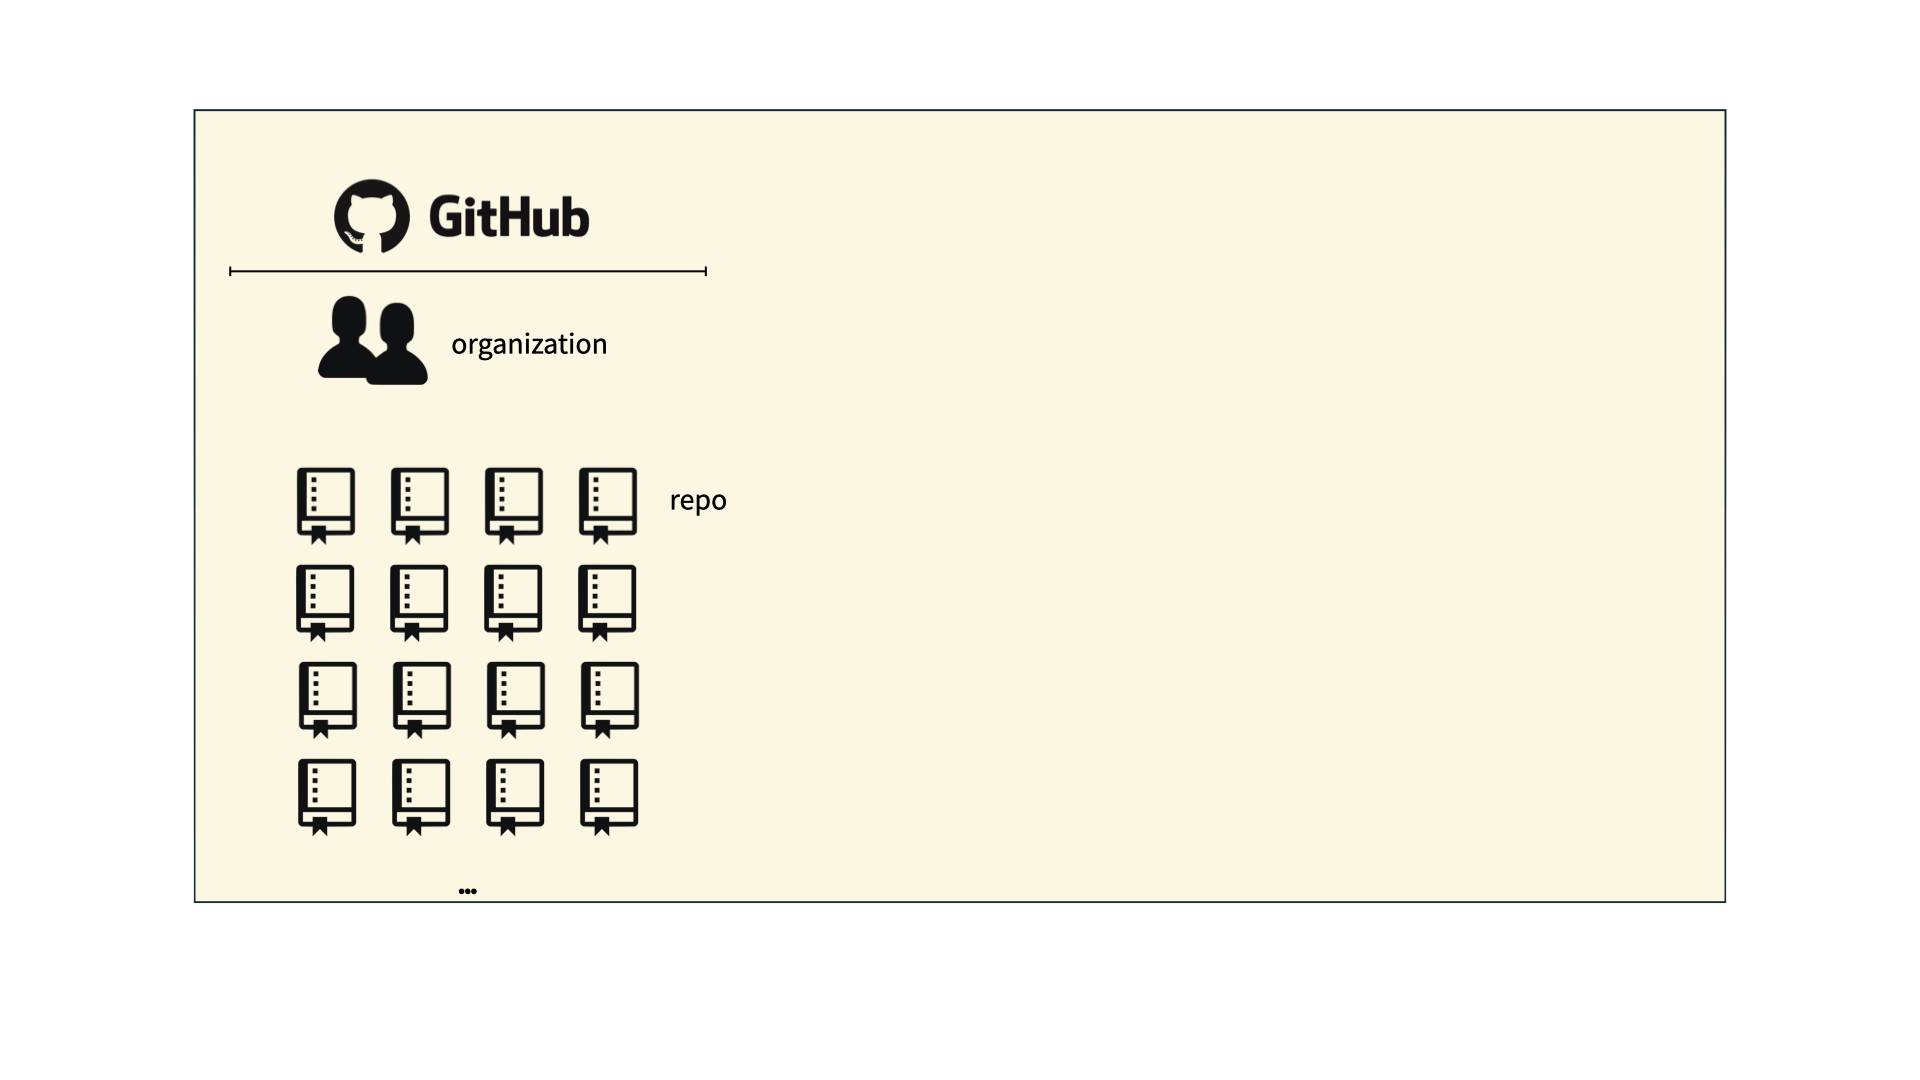
How will we use Git and GitHub?
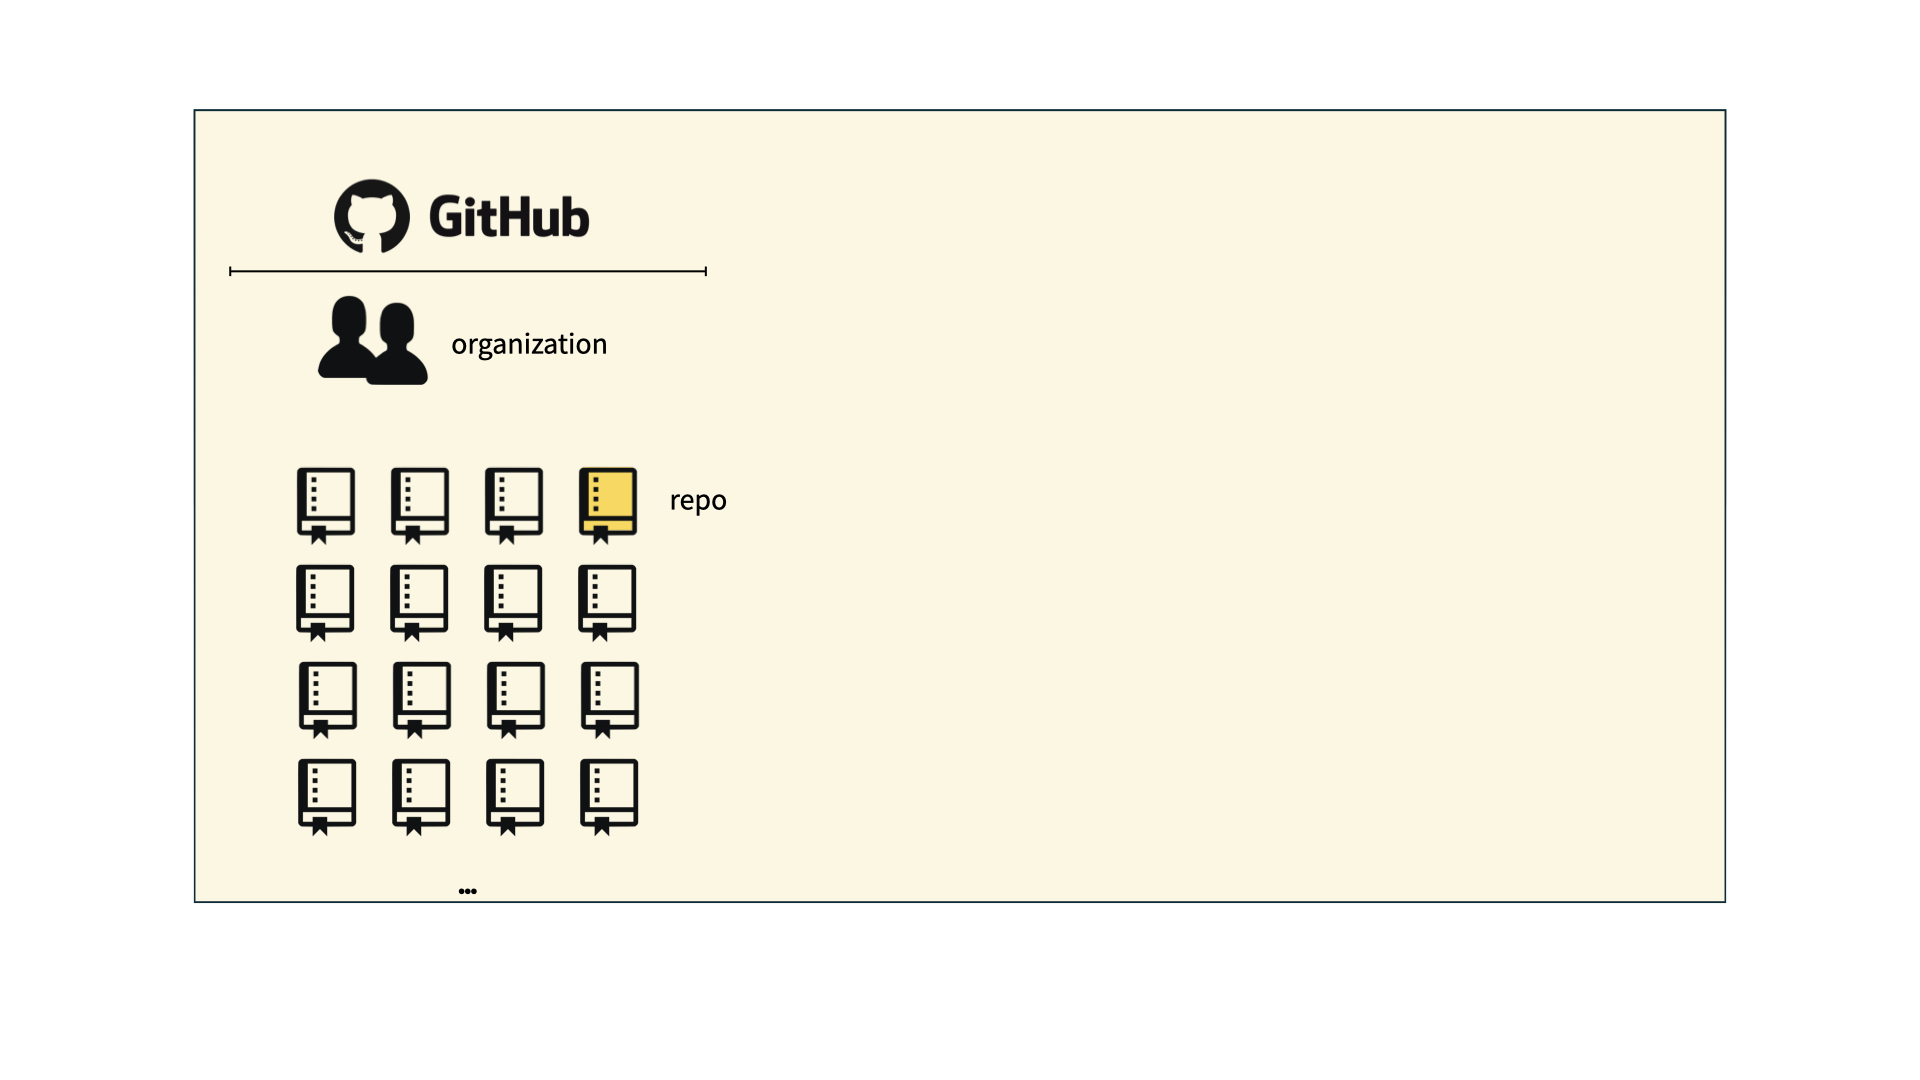
How will we use Git and GitHub?
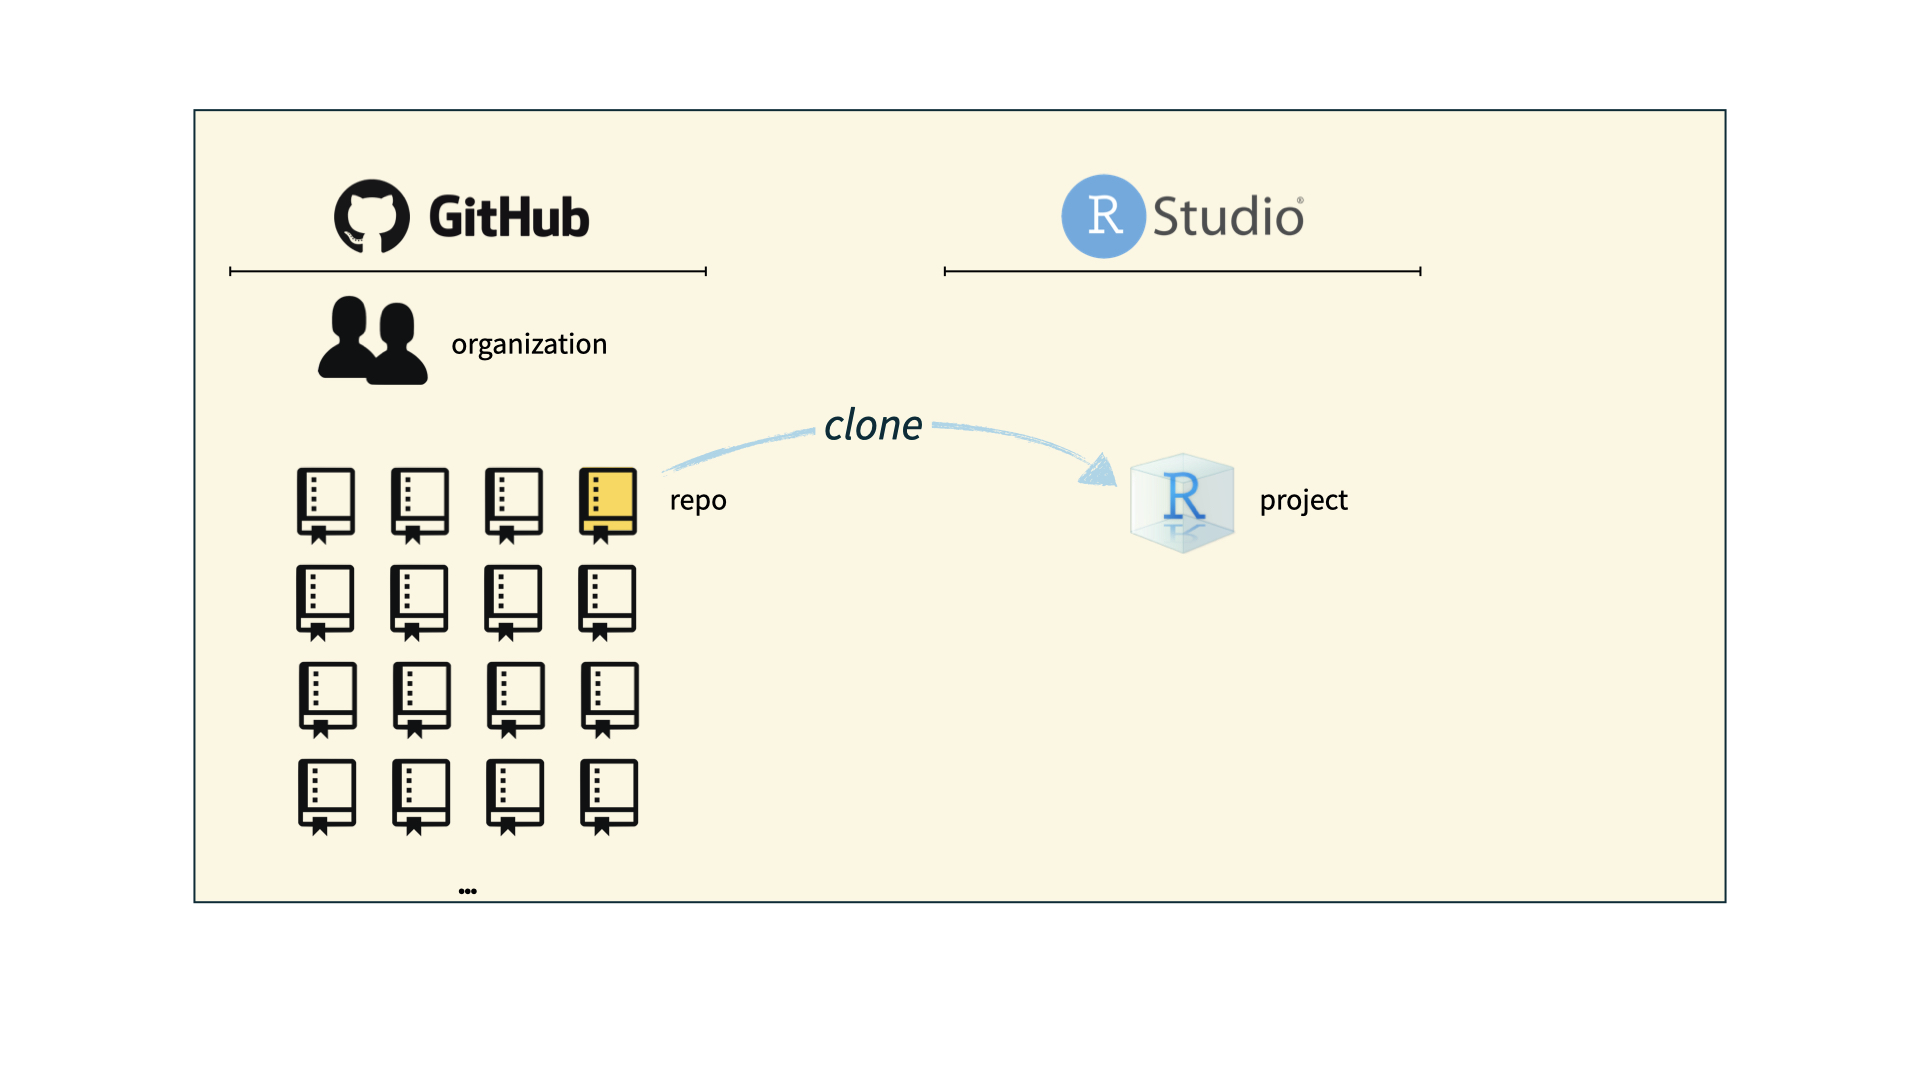
How will we use Git and GitHub?
Tour: Git + GitHub
- In Lab 0 next Monday!
- Make sure to create a GitHub account and fill out the Getting to know you survey!