Grammar of graphics
Lecture 3
9/6/22
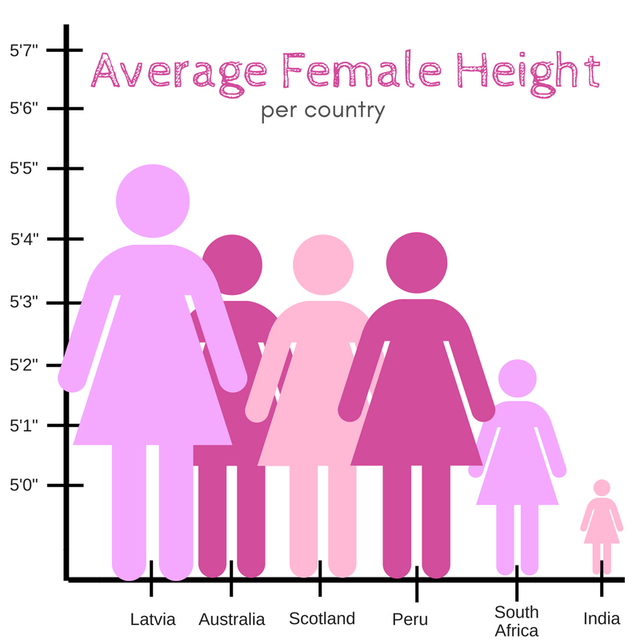
Examining data visualization
Discuss the following for the visualization.
What is the visualization trying to show?
What is effective, i.e. what is done well?
What is ineffective, i.e. what could be improved?
What are you curious about after looking at the visualization?
04:00
Recap of AE
- Construct plots with
ggplot(). - Layers of ggplots are separated by
+s. - The formula is (almost) always as follows:
- Aesthetic attributes of a geometries (color, size, transparency, etc.) can be mapped to variables in the data or set by the user, e.g.
color = binaryvs.color = "pink". - Use
facet_wrap()when faceting (creating small multiples) by one variable andfacet_grid()when faceting by two variables.