Visualizing various types of data
Lecture 4
Dr. Mine Çetinkaya-Rundel
Duke University
STA 199 - Fall 2022
9/8/22
Warm up
Announcements
- HW 1 posted this evening, due 11:59pm on Thursday, Sep 15
Wrap up ae-01
- Any questions from Part 1?
- Demo: Part 2
Identifying variable types
Identify the type of each of the following variables.
- Favorite food
- Number of classes you’re taking this semester
- Zip code
- Full name
- Age
02:00
Questions from the prepare materials?
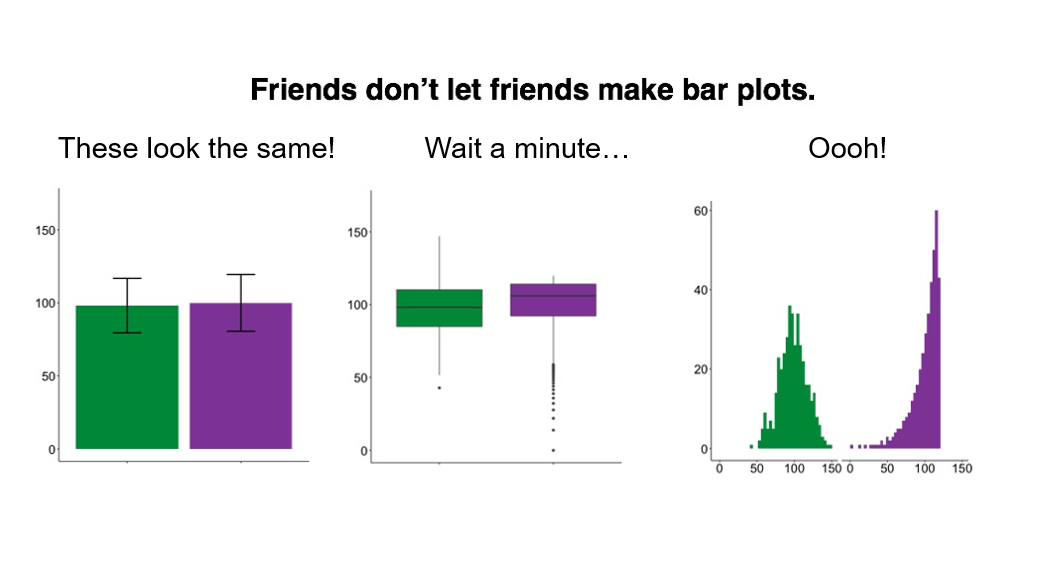
The way data is displayed matters
What do these three plots show?

Source: #barbarplots
Application exercise
ae-02
- Go to the course GitHub org and find your
ae-02(repo name will be suffixed with your GitHub name). - Clone the repo in your container, open the Quarto document in the repo, and follow along and complete the exercises.
- Render, commit, and push your edits by the AE deadline – 3 days from today.
Recap of AE
- Pick geoms based on data types.
- Set appropriate binwidths for histograms.
- Turn off legends when they provide redundant information with
show.legend = FALSE. - Create plots with multiple geoms, and pay attention to order.
