Communicating data science results effectively

Lecture 24

Dr. Mine Çetinkaya-Rundel

Duke University
STA 199 - Fall 2022

11/29/22

Warm up

Announcements

  • Office hours today 2:45 - 4:45pm in person or on Zoom

  • Remaining due dates:

    • Peer eval 2 due tonight by 11pm. Late submission is not possible!

    • Survey on Sakai for topics requested for next week.

    • Project presentations next Monday in lab – all team members must be present.

    • Project write-up and final repo due 11:59pm Thur, Dec 8 – you will lose access to your repo at this time.

    • HW 6 due 11:59pm Friday, Dec 9.

    • Remaining application exercises due on the usual schedule.

    • (Optional) Exam retake – due 11:59 pm Thur, Dec 15 – absolutely no late submissions, extensions, etc. for any reason.

Exam retake

  • Released after Exam 2 grades are released, by next week.

  • Weighted average between your lowest exam score and what you earn on the retake

  • If you earned a 0% on Exam 2 and earn 100% on Exam Retake, you will earn an 85%.

  • Overall task: Create a six question assessment covering specific topics from the course, write a key and a grading rubric for each, as well as a justification.

Project

  • Review peer evaluations left by your peers, implement updates as you see fit, close the issue once you review them.

  • Have a clear plan for who is doing what, open issues on your repo, and assign them to individuals who can then close the issues as they finish a task.

  • Schedule at least one team meting between today and your presentation to practice your presentation together.

Effective communication

What’s going on in this plot?

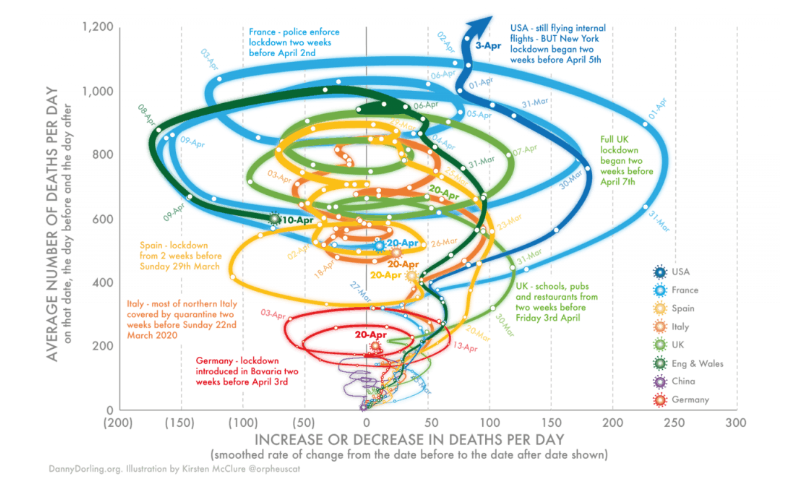
Take A Sad Plot & Make It Better

Source: https://alison.netlify.app/rlm-sad-plot-better

Application exercise

ae-20

  • Go to the course GitHub org and find your ae-20 (repo name will be suffixed with your GitHub name).
  • Clone the repo in your container, open the Quarto document in the repo, and follow along and complete the exercises.
  • You should have already pushed updates on Tuesday, so you should be good for submission.

Recap

  • Represent percentages as parts of a whole
  • Place variables representing time on the x-axis when possible
  • Pay attention to data types, e.g., represent time as time on a continuous scale, not years as levels of a categorical variable
  • Prefer direct labeling over legends
  • Use accessible colors
  • Use color to draw attention
  • Pick a purpose and label, color, annotate for that purpose
  • Communicate your main message directly in the plot labels
  • Simplify before you call it done (a.k.a. “Before you leave the house, look in the mirror and take one thing off”)